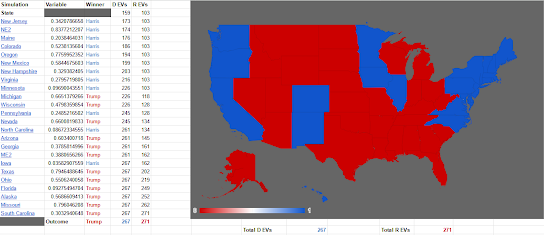
So I decided to come back and do some more simulations.
Simulation 31
In this simulation, Harris wins all 7 swing states, getting a 319-219 decisive victory, and then for some weird reason loses Maine, a D+11 state. Yeah it doesn't make sense to me either. That's randomness for you though.
Simulation 32
Another decisive Harris win. She wins MI/PA/NC/AZ/GA but loses WI and NV. Kind of a weird map, but given it stuck to the 7 big swing states at least it's more plausible than the previous one.
Simulation 33
Here we win WI, NV, and Ohio for some reason, but lose the other swing states. yeah, it doesn't make sense either.
Simulation 34
Harris wins MI/PA/NV/NC/GA but loses WI/AZ, I guess it can happen, WI can be weird....
Simulation 35
AZ and NC, but Trump wins everything else.
Simulation 36
NV/GA, and Iowa for some reason. Harris still loses. Probably can't happen. The amount of blue iowa maps im getting is kinda weird though.
Simulation 37
Simulation 35 again but this time with us winning ME2
Simulation 38
PA,NC, and then IA...another blue Iowa map. Anyway, we still lost this one.
Simulation 39
We wn PA and NC, but then lose VA. I dub this, the map where trump BTFOed us, except he alienated latinos in pennsylvania and mark robinson won NC.
Simulation 40
We win PA, but then lose NH and MN somehow. Another "blowout, except latinos in PA got pissed over the MSG rally" result.
Tally so far
28 Trump, 12 Harris
Still not looking good for Harris. Trump seems to be winning 70% of simulations so far, when I'd only expect him to win 55-60% of them. I may have to dust what remains of the big simulator off and use updated data (minus NJ) to see what's going on.
Okay I tried to do that and it basically bugged out on me due to some changes I made right before retiring it. Anyway, long story short....yeah I'm getting something closer to Trump winning 55-60% of them with the same data. Must just be the sample I'm getting and random variation. Normally larger sample sizes can offset trends like this, but you can get more outlier cases with smaller sets of data. it's why the margin of error is larger with smaller sample sizes.
Anyway, I'm surprised at how many different outcomes this thing keeps spitting out. The overwhelming majority are unique so far, I've only had two repeats in 42 trials so far. And I havent even gotten some of the maps I was hoping come up. Still havent gotten a vanilla 319-219 map. Still havent gotten a 226-312 map either. And still havent gotten any of the fun 269-269 scenarios I hoped will come up. But there's still time. I'll keep doing these in sets of 10 until election day, hoping to have at least a pool of 100 scenarios to choose from. And I'm hoping one of these represents the real outcome. We'll see though. It's possible most of these random scenarios are nonsense. This isn't the best simulator in the world. It's just a little project of mine.


No comments:
Post a Comment